Working with SOEP Documentation
Variable Search with Questionnaires
If you come across a variable in the data set whose variable content is unclear, you should always check whether there is a suitable questionnaire for the data set. Under Overview Data Sets you can see whether the data sets correspond to a survey instrument. The related questionnaires can be found here:
Example: During your research project you come across the variable bbh5508 with the German label “Auto: Gründe” (Car: Reasons) and the Englisch label “Reason for No Car in Household

Unfortunately, it is difficult to determine the variables content from the output and also from the label designations. To understand the complete question and also possible filter instructions, you should use the questionnaires.
Example Variable:
bbh5508: Wave „bb“ (Survey Year 2011); household questionnaire („h“), question number 55, item 8
Open Questionnaires
The variable “bbh5508” can be found in the questionnaires for 2011. Select the survey year 2011 and download the household questionnaire.

Search the variable “bbh5508” in the questionnaire
Since you are already in the correct questionnaire, you must now search for question 55.
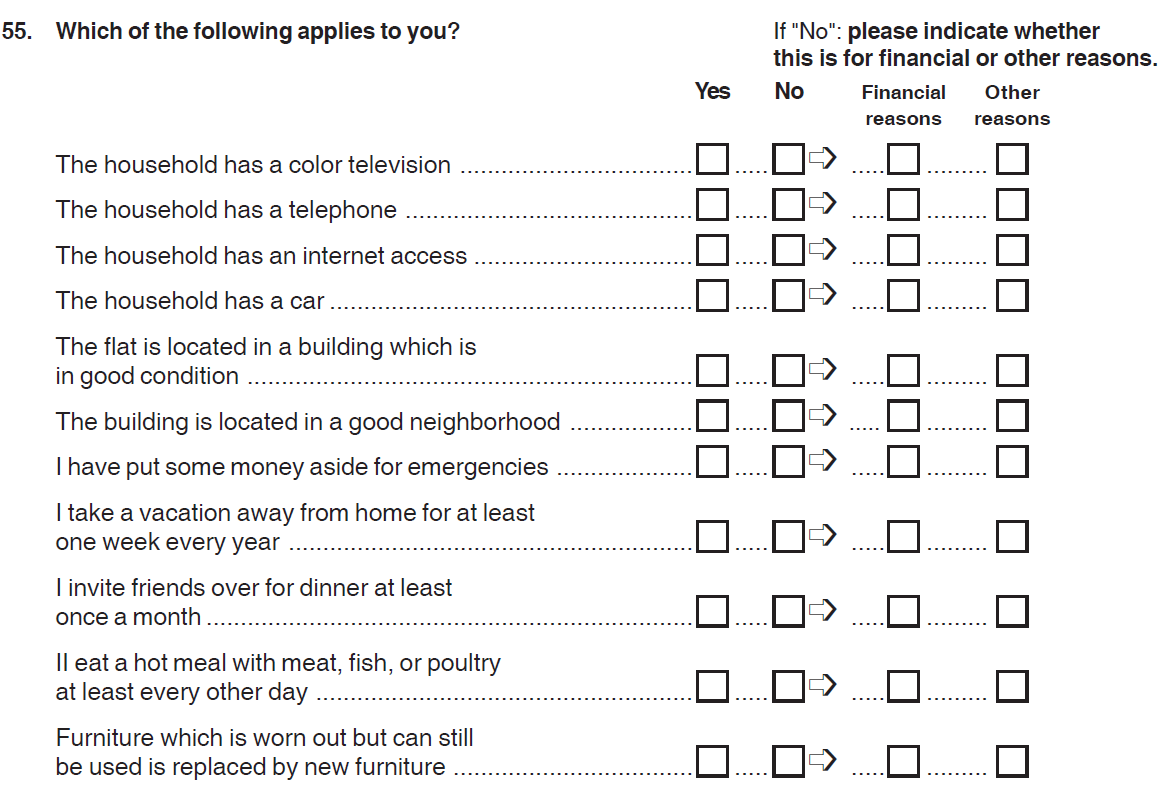
To understand which information the variable “bbh5508” contains, you have to deal with the question. For each answer category, respondents should indicate whether or not the shown items apply to the household. If the item does not apply, respondents must answer an additional question about the reasons. Both questions should be understood as separate variables. The variable “bbh5501” indicates whether a TV is present in the household. The reasons why there is no TV in the house can be found in the variable “bbh5502”. The variable “bbh5507” shows whether a car is present in the household and the variable “bbh5508” shows reasons why no car is present in the household. By looking into the questionnaire, the variable is now easier to understand. The variable “bbh5508” only contains people who do not have a car in their household and shows the reasons given.
Variable Search with paneldata.org
With paneldata.org it is also possible to search for variables. For example, if you want to find more information about generated variables, a search with paneldata.org is indispensable. For example, the platform offers comprehensive frequency counts, the chronology of the variables searched for, a cross-study variable linkage via concepts, a syntax generator and a topic list for content search in the SOEP.
Example Variable:
bbh5508: Wave „bb“ (Survey Year 2011); household questionnaire („h“), question number 55, item 8
Open Paneldata.org

Please select the study SOEP-Core. The SOEP-Core overview contains important general information about the study, e.g. data access, survey method, questionnaires, thematic diversity, terms for missing codes, all available data sets of the study and metadata-based questionnaires. To search for a variable, a data set or a publication, simply enter the desired search term in the search field.

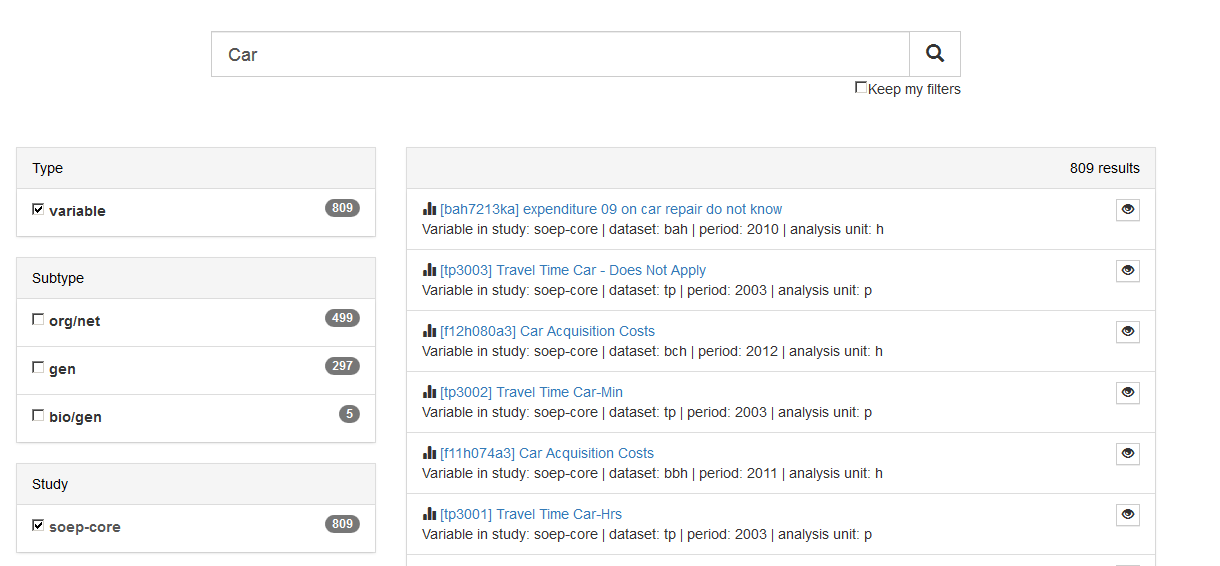
In order for the search to be successful, specific information from the user are necessary. The results window displays all results of the search. It can be seen that the variable “bbh5508” originates from the data provided by SOEP-Core and can be found in the data set “bbh” (survey year 2011). If your search is not so specific, you can also search by keywords. We are still interested in the topic “car”.

To better limit the 1091 results, the filter options on the left should be used. We are looking for variables from the ordered SOEP-Core datasets. In the windows “type” and “study” we select “variable” and “soep-core”.
Now all variables are displayed, which contain the term “Car” in the SOEP-Core data. The variable search can be further limited by specifying the data set or the survey year. For more information about the different data sets in SOEP-Core visit the chapter Data Sets SOEP-Core. To select original data that can be assigned to a question in the questionnaire, select the subtype “org/net”. The specific selection of the analyzing unit allows you to choose whether the variable should provide information on the household level(“h”) or on the individual level (“p”). If you are interested in household-specific variables, select “h” as the “Analysis unit”. If you are explicitly interested in the survey year 2011, the variable search can be limited to five variables.
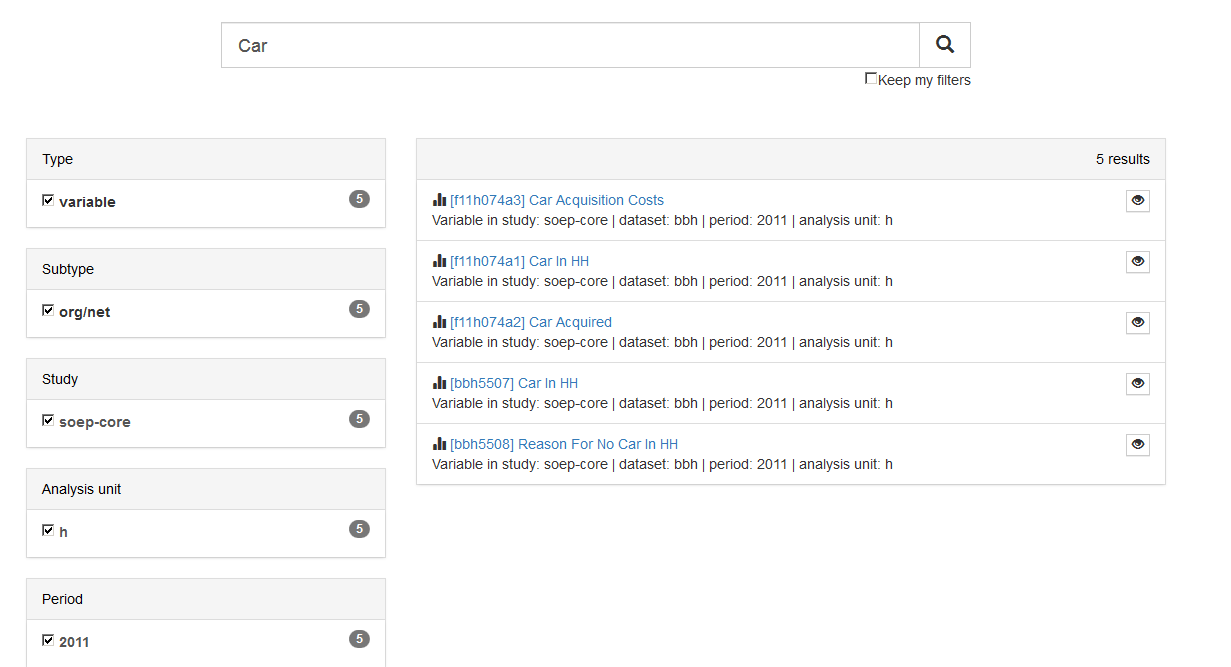
There are only five results left, which also shows our searched variable. If you click on the variable “bbh5508” you will get additional information about the variable.
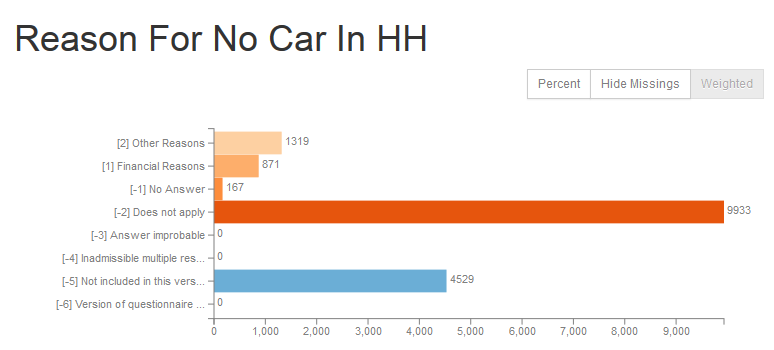
First you see the weighted absolute frequencies for the variable. It is possible to remove the missing codes from the analysis and/or to display the relative frequencies. Even without opening the data set, Paneldata.org gives you a good overview of the frequencies of a variable.
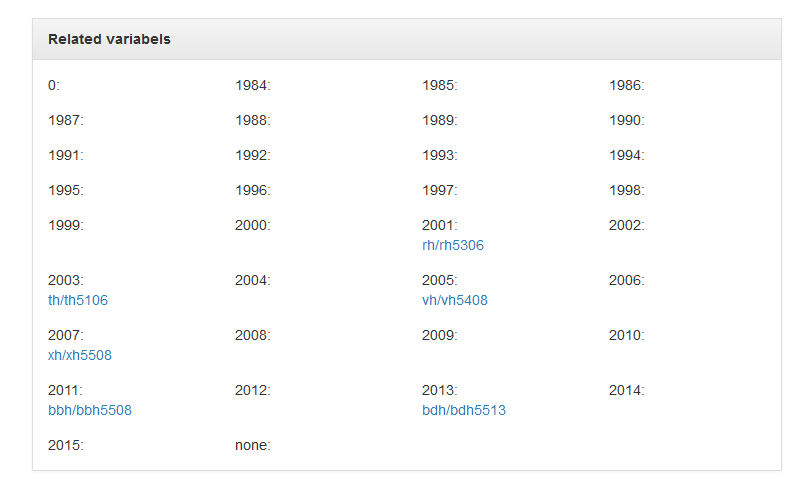
In the Related Variables section you will also find the chronology of the variable you are looking for. The sample variable was collected in 2001, 2003, 2005, 2007, 2011, 2013. Below the survey year, the name of the variable in the respective year is displayed and can be clicked to access the respective variable page. At one glance it is possible to see when a variable was measured, how often it was measured and what its name is in the respective survey year

The field “Label translations” shows the value labels of the variables in German and English. In addition, all missing codes used in SOEP are listed and explained.
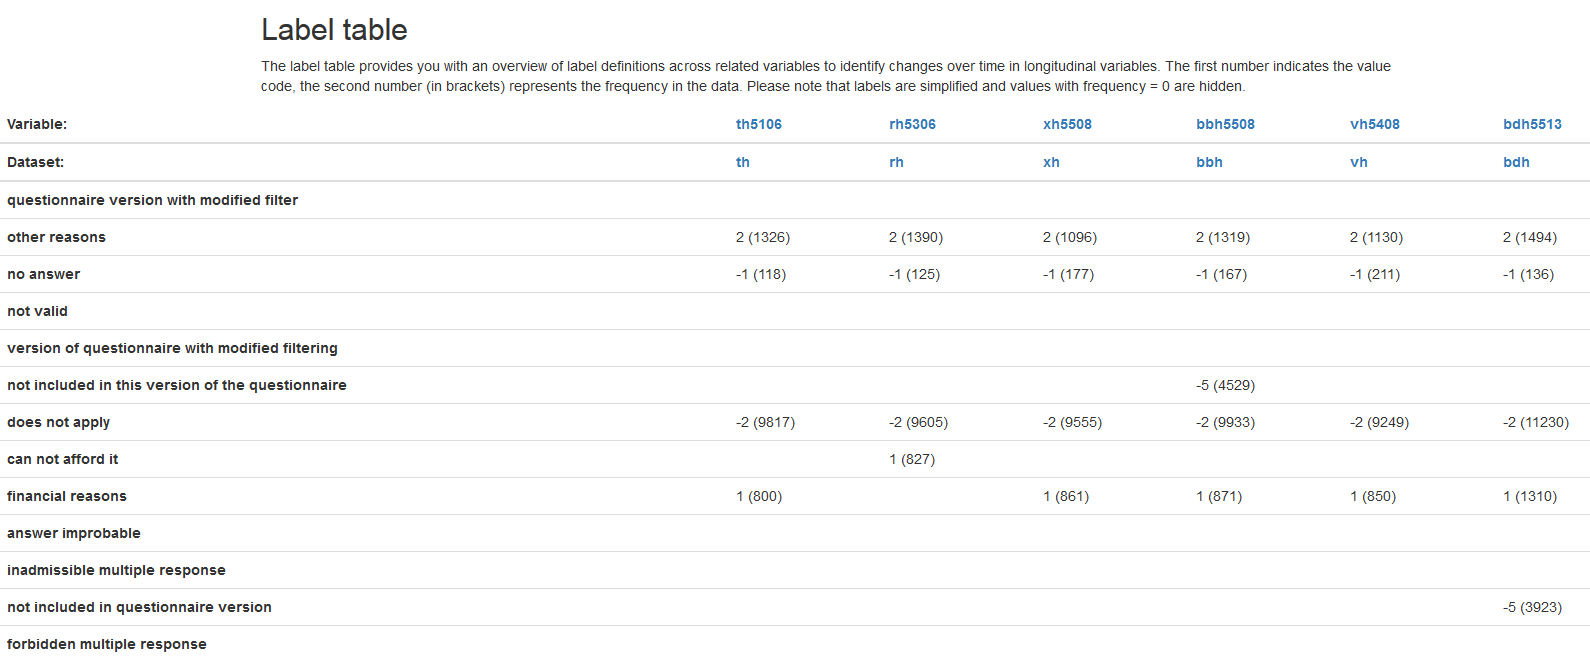
The Label table window shows you the absolute frequencies of the variable at different collection times. This makes it possible to identify initial trends in how response behaviour has changed over a period of time. The assigned value code is output for each possible characteristic value and the absolute frequencies are displayed in parentheses.
In our example output we see that for the variable “th5106” 800 respondents in the wave “t” (2003) state “financial reasons” as the reason for the absence of a car in the household. For our example variable “bbh5508” in the survey year 2011 (wave “bb”) there are already 871 respondents.
Paneldata.org is an excellent way to get an first overview of certain variables.
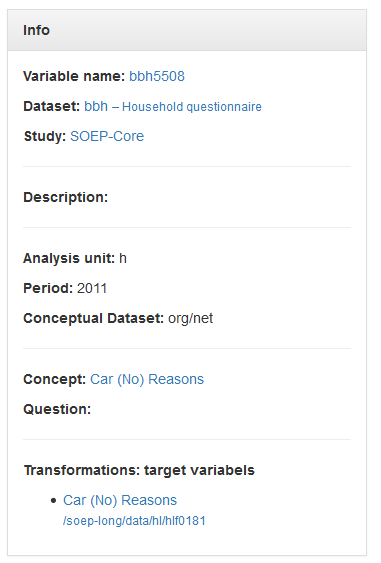
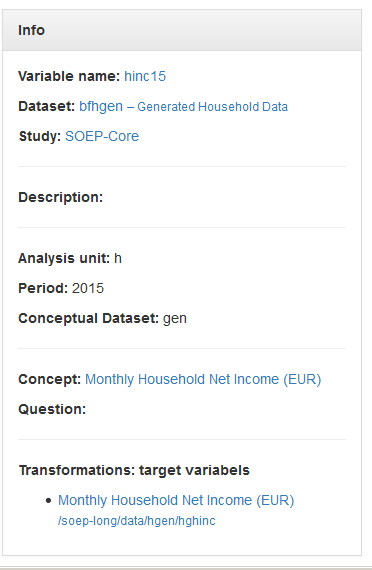
The info box on the right-hand side provides an overview of all relevant information about the variable and the data set. Beside the basic information you will find the information what kind of variable you are looking for under “Conceptual Dataset”. In our example “bbh5508” you can see that variables with a “Conceptual Dataset: org/net” describe original variables that are assigned to a questionnaire. Generated variables are “Conceptual Dataset: gen”. To get an overview of the different data set types of SOEP-Core, visit the chapter Overview Data Sets. In addition, the info box under “Transformations: target variables” provides a link or forwarding to the variable in “long” format. For a more detailed understanding of the long format, read the chapter Data Structure in long Format (long).
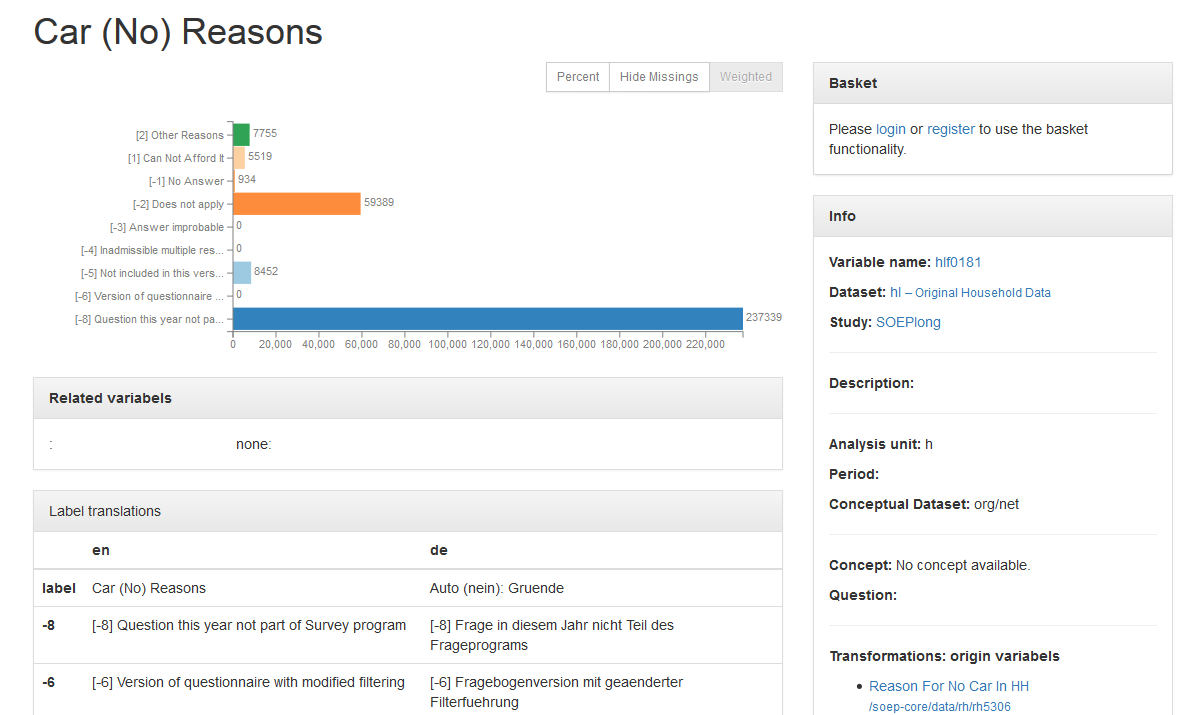
As soon as you click on the “long” variable, you will get to the variable overview for this variable in long-format. The overview of variables does not differ. It can be seen that our example variable “bbh5508” can also be found in long-format in the data set “hl” with the variable label “hlf0181”.
In addition to searching for keywords or using the various filter settings, you can also find what you are looking for directly in the data set search. Open paneldata.org, click on the study SOEP-Core and select the menu field “data”.

Now you get to an overview which shows you all data sets contained in SOEP Core.

Enter the data set you are looking for (“bbh”) in the search field at the top right and click on the data set. You are forwarded to an overview which shows you all variables from the “bbh” data set.
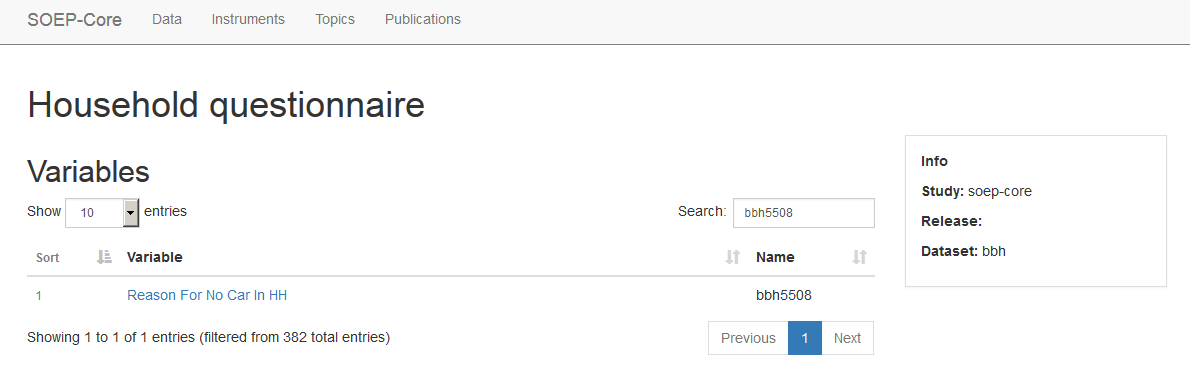
Now enter the variable you are looking for in the search field at the top right and click on the desired variable. You are then forwarded to the variable overview and receive detailed information about the variable. Paneldata.org offers the user very different search options to suit the individual search behavior of each user.
Topic Search with paneldata.org
In order to obtain an overview of the content of the variables provided by the SOEP, the variables on paneldata.org were assigned to different topics. If you are looking for your research variables and do not want to check all data sets or questionnaires, the topic search on paneldata.org could help you. Open Paneldata.org and select the main study SOEP Core. The upper navigation bar leads you to the Topics area. Click on Topics and have a look at the list of variables.
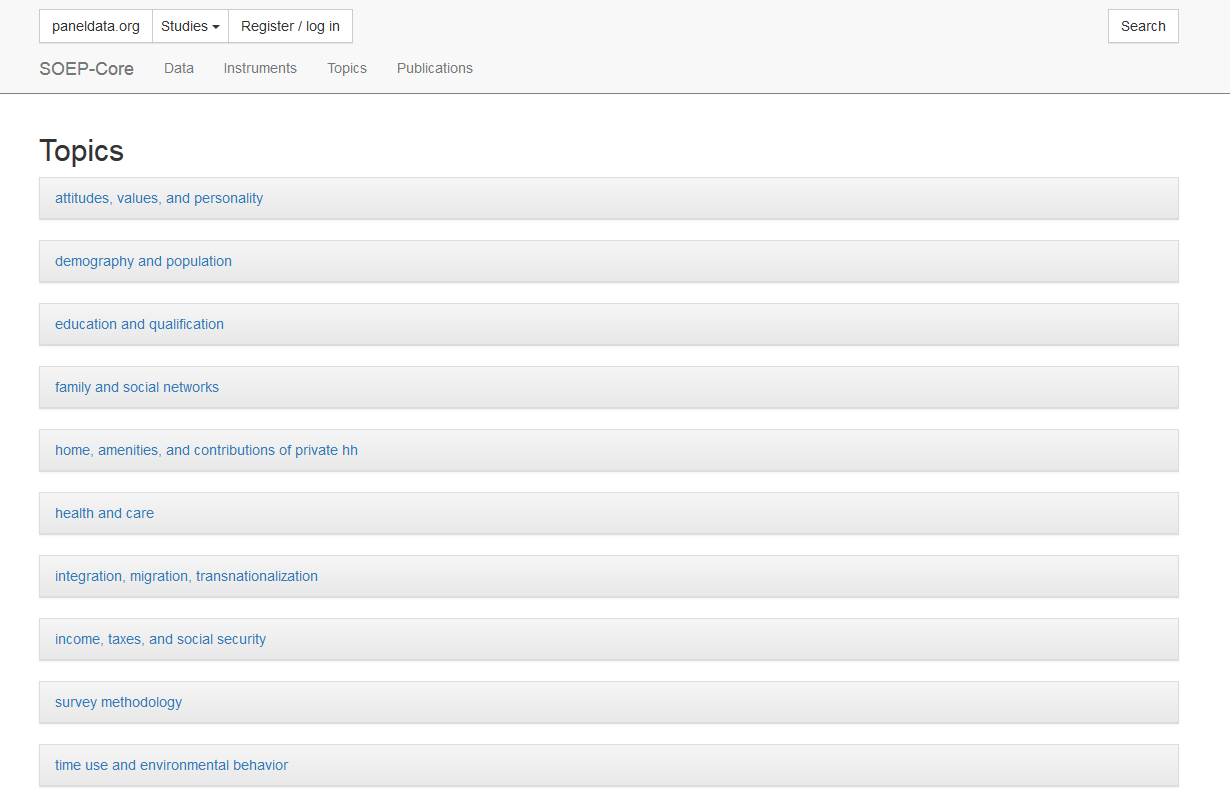
Select a topic that corresponds to your research interest and a more specific selection of topics will appear
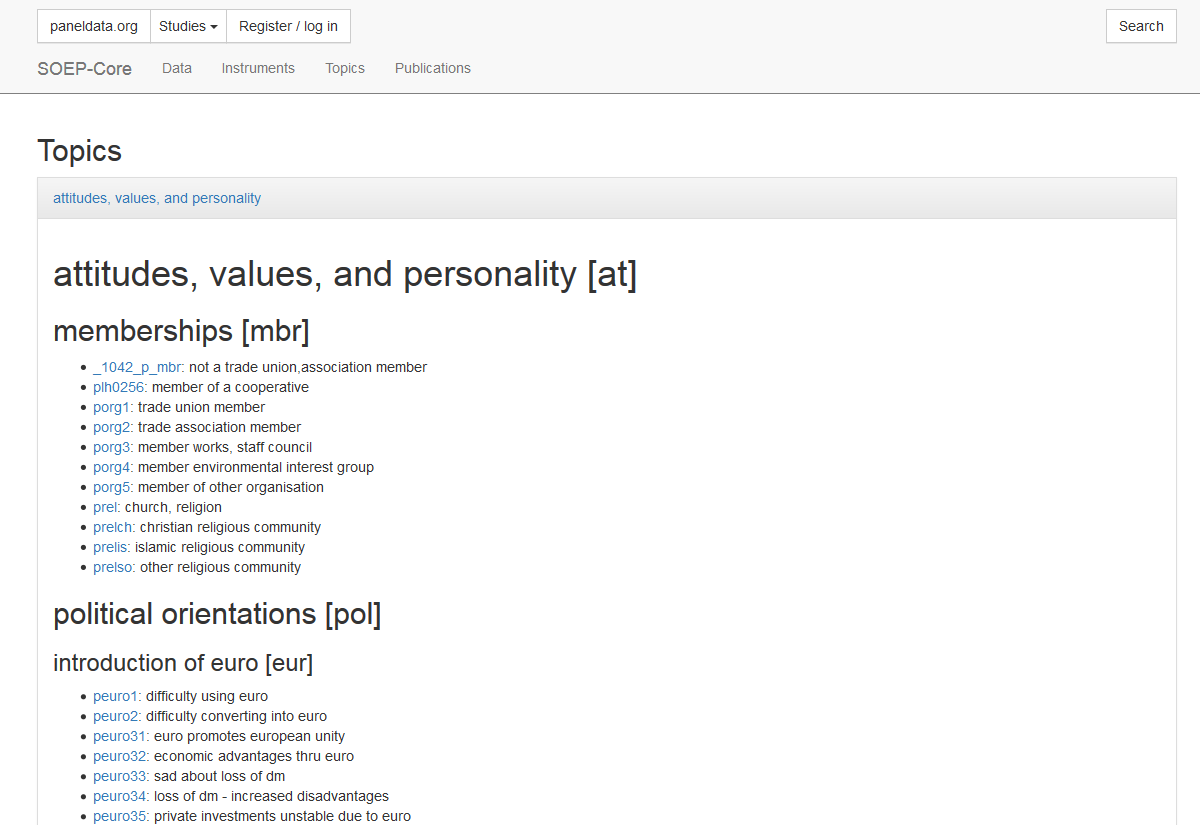
For example, if you are interested in different types of satisfaction, select the appropriate topic “attitudes, values, and personality [at]”. With a little search you will discover the sub-topic “satisfaction[sat]”.
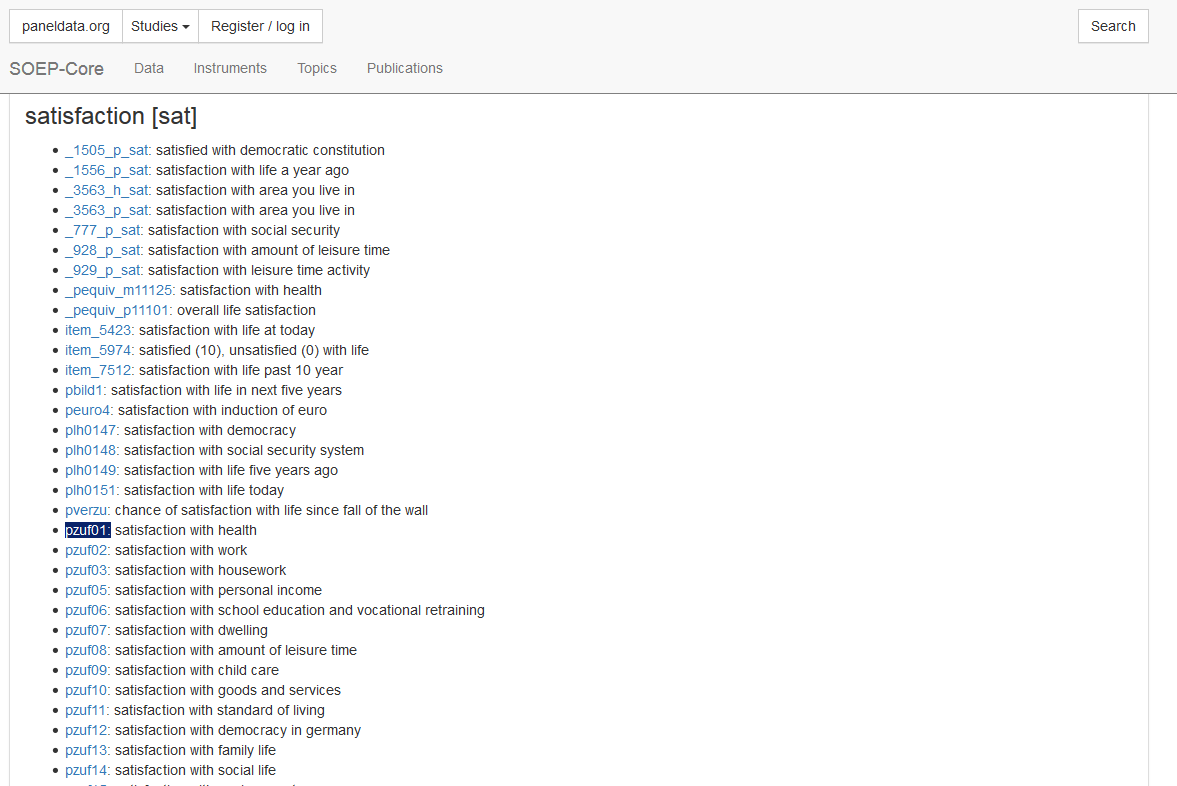
Suppose you are interested in health satisfaction. Based on the label, the “pzuf1” concept could be of interest to you. By clicking on the concept “pzuf1” you will get to the concept overview.
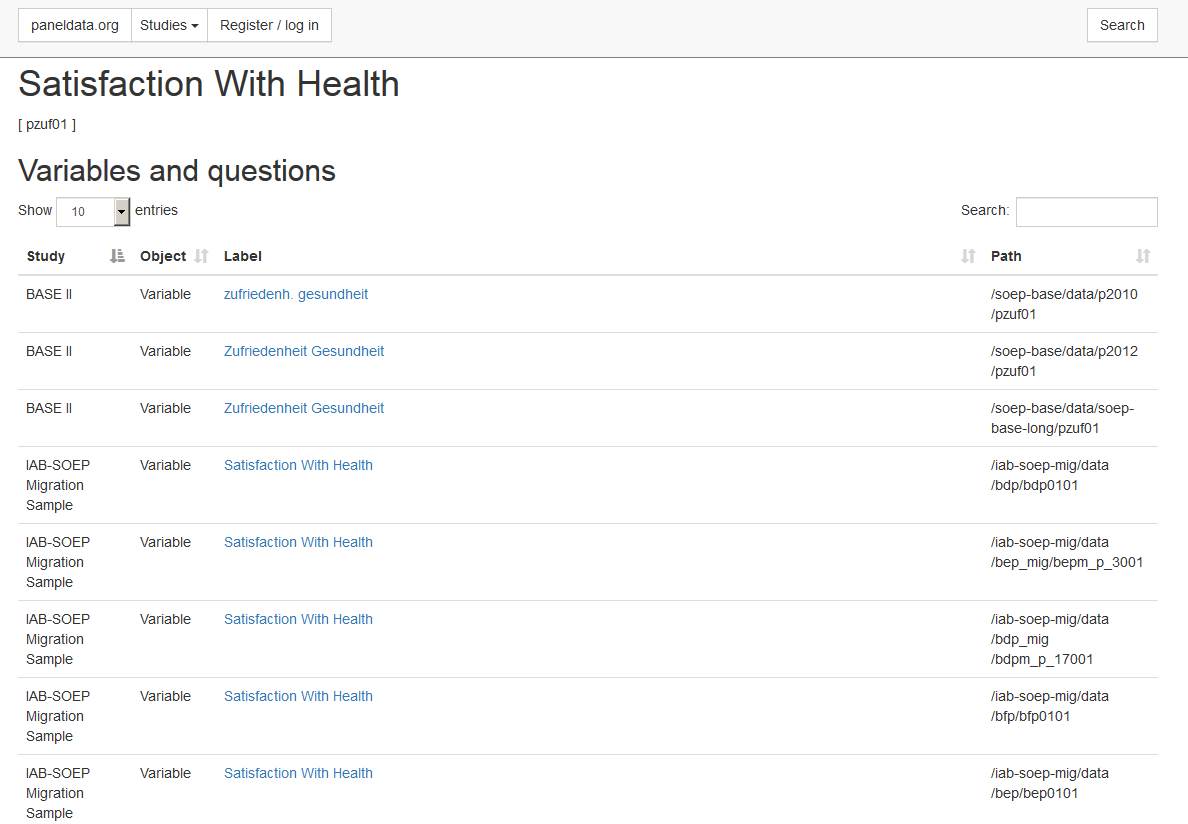
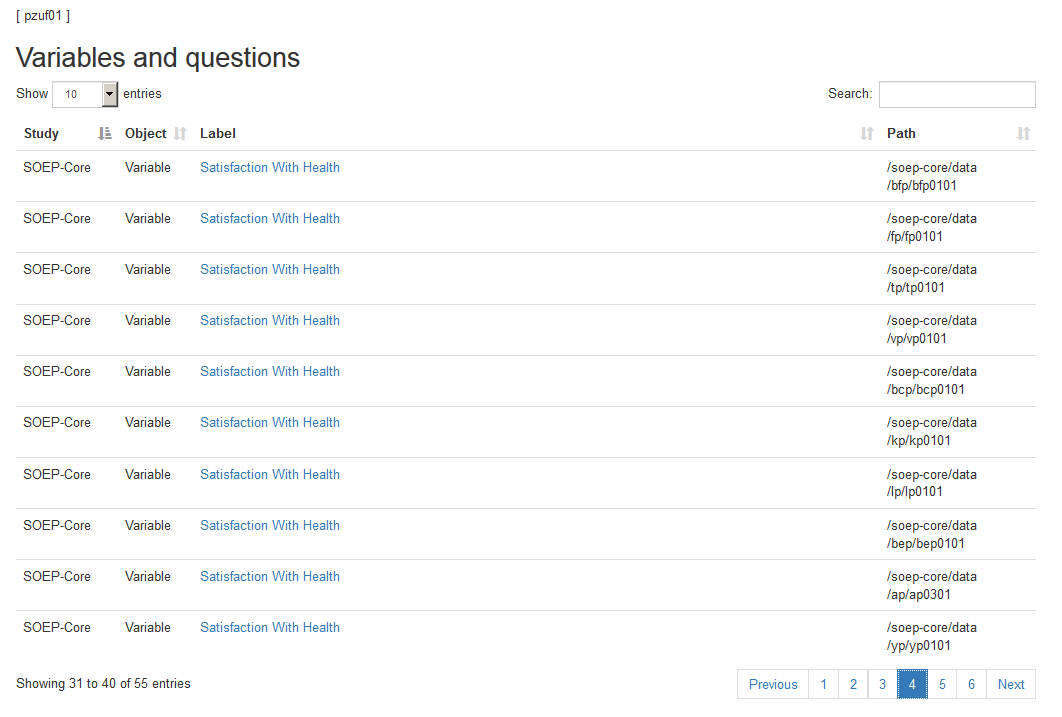
The concept overview displays the study and wave specific variables of the concept. The concept allows you to determine whether the variable you are looking for is also available and comparable across studies. In the column “Study” you can see in which studies the same variable is linked via the concept. The label of the respective variable is also displayed in the “Label” column. The column “path” shows the wave name of the variable. By clicking on the label you will get to the known overview of variables with all relevant information. The “Object” column in the concept overview shows you the type of information which is displayed.
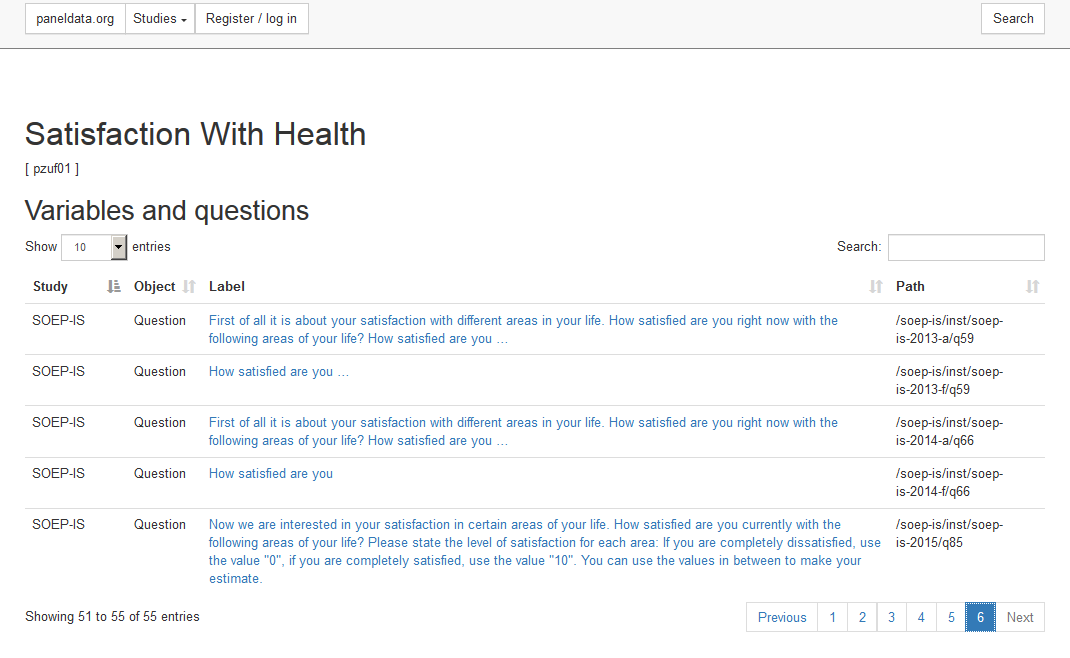
In addition to the variables linked via the concept, you can find the relevant questions in the concept overview. Questions are displayed in the “Object” column with question. Without having to open the questionnaire, you can get an overview of the question and determine possible differences. Click on the desired question and you will be taken to the question display.
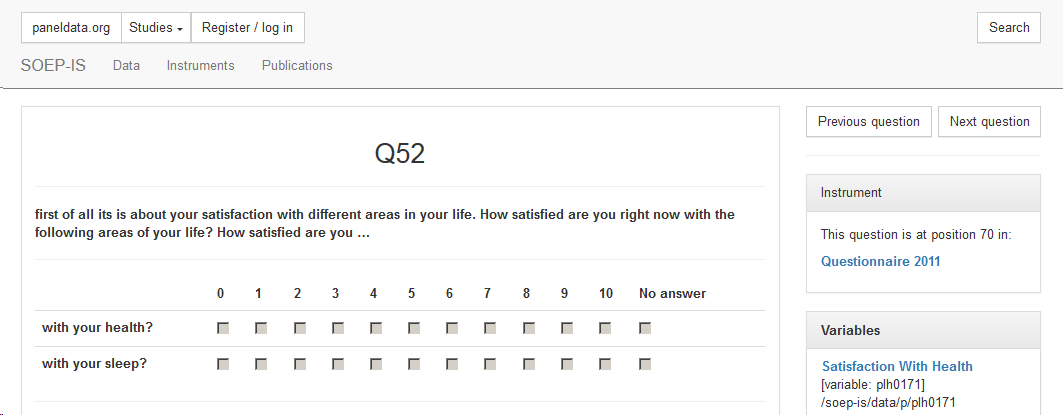
Attention: The variable search via the questionnaires is unavoidable in order to find out the exact wording of the question and the possible filter structure. The question display of Paneldata.org only provides a quick overview. In the question overview you can navigate through the questionnaire using the “next question” and “previous question” buttons. The “Instrument” section shows the position of the question in the questionnaire, the survey year and links to the metadata-based survey instrument. Click on the survey instrument “Questionnaire 2011”.
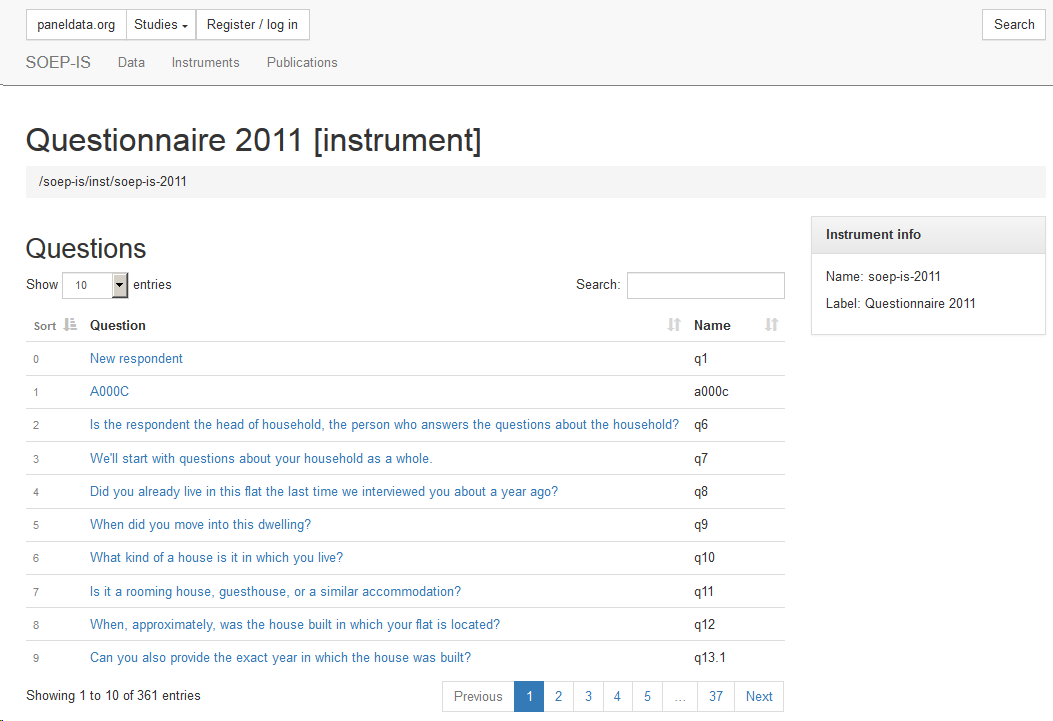
The survey instrument for the survey year 2011 of the SOEP-IS study is now displayed. You can navigate through the questionnaire in this overview. The search field allows you to search for research-relevant terms. Click on the question to access the question display.
Documentation of Generated Data
The range of generated variables and data sets from SOEP-Core is very extensive. To make work easier for users, many variables are already generated for the user in the data preparation process and published with SOEP-Core. The large number of generated data sets and variables is comprehensively documented so that the generation process remains transparent for the user. Here you will find an overview of the Documentation Generated Data
Example: A number of frequently used variables are provided in SOEP as so-called generated variables (e.g. data sets $PGEN and $HGEN). These variables are checked for consistency across waves and have a uniform name. Please use the appropriate documentation to answer the following questions:
a) In which variable is the highest school leaving degree for the persons surveyed in 2007?
To search for the variable with the highest school leaving degree, use paneldata.org. Open Paneldata.org and enter school leaving degree in the search field. Then specify your search by adjusting the filter settings as follows:
- type: variable
- subtype: gen
- study: soep-core
- analysis unit: p
- period: 2007
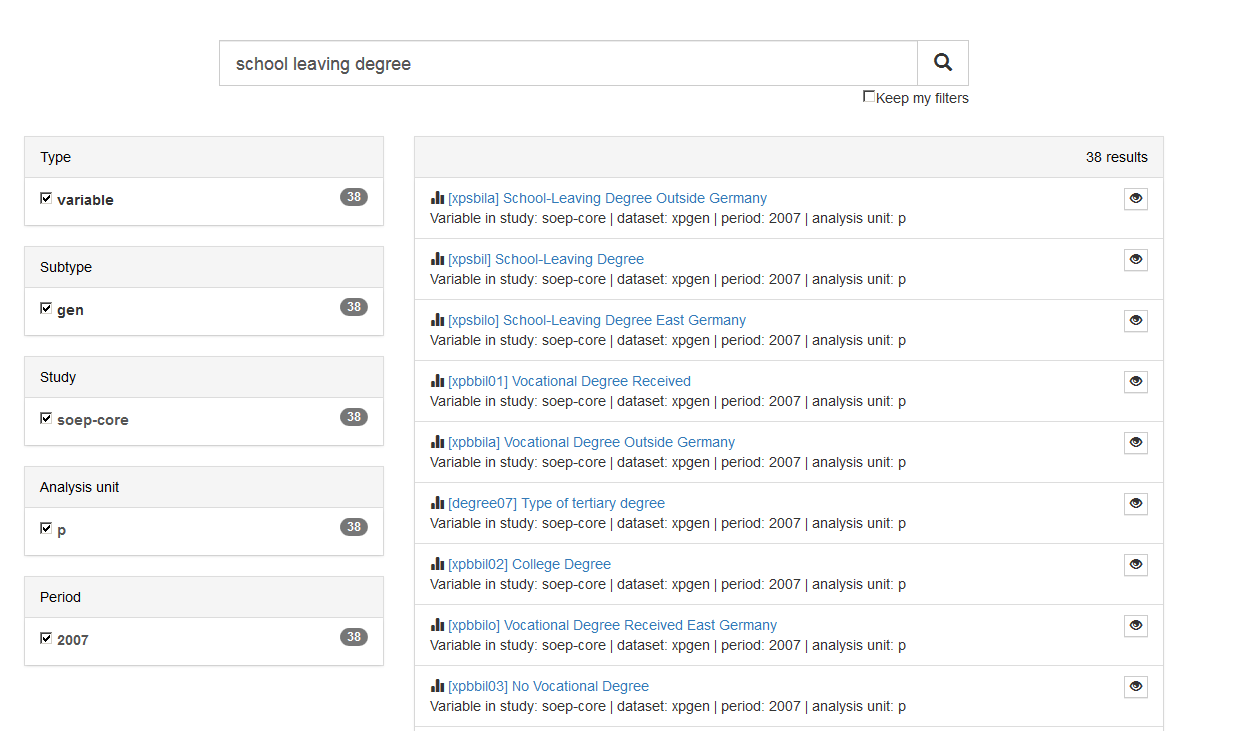
All variables could contain the information you are looking for. Since almost all variables in the search result come from the generated “xpgen” data set, the documentation for the $pgen data set should be used. Open the Documentation Generated Data

Now select the documentation of $pgen

The table of contents on the left shows you a thematic classification of the data set. To find the variable you are looking for, select topic area 10.

After a few searches you will find the variable you are looking for. Some interesting information can be derived from the documentation. It can be seen that the information from the generated variable has been taken from the CV questionnaire since 1994 and is surveyed once. In addition, the two additional variables $psbila and $psbilo are explained in more detail. The documentation describes that the $psbil variable is updated regularly and also takes into account possible changes in the highest level of education. This is precisely why it is worth using the generated variable to represent the most recent highest school leaving degree of those surveyed.
The variable we are looking for is xpsbil and describes the highest school leaving degree of the persons surveyed from the survey year 2007.
b) Which values are given to persons with Upper Secondary Degree (Abitur) in this variable??
Since you now know the variable you are looking for, you can use the extensive functions of paneldata.org in addition to the information from the documentation. If you search for the variable “xpsbil” in paneldata.org and click on it, the frequency counts are displayed.
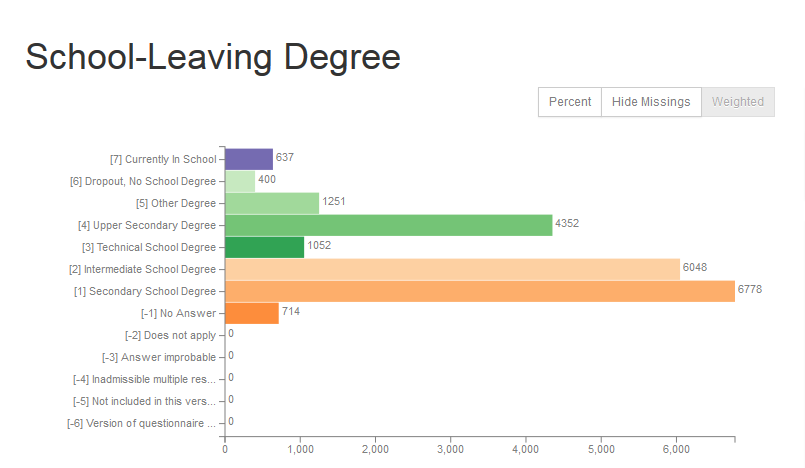
In addition to the absolute and relative frequencies, you can also read the value codes of specific response categories. A translation of the answer categories can be found in the “Label translations” section:

You can answer the question without opening the data. In the 2007 survey year, the variable “xpsbil” with the value code “4” describes the answer category “Upper Secondary Degree (Abitur)”.
Syntax Generator on paneldata.org
Paneldata.org allows registered users to collect and save their research-relevant variables in a variable basket. These variables can be simply written into a single data set with the script generator. The script generator helps you with data management and can save valuable working time.
Open Paneldata.org
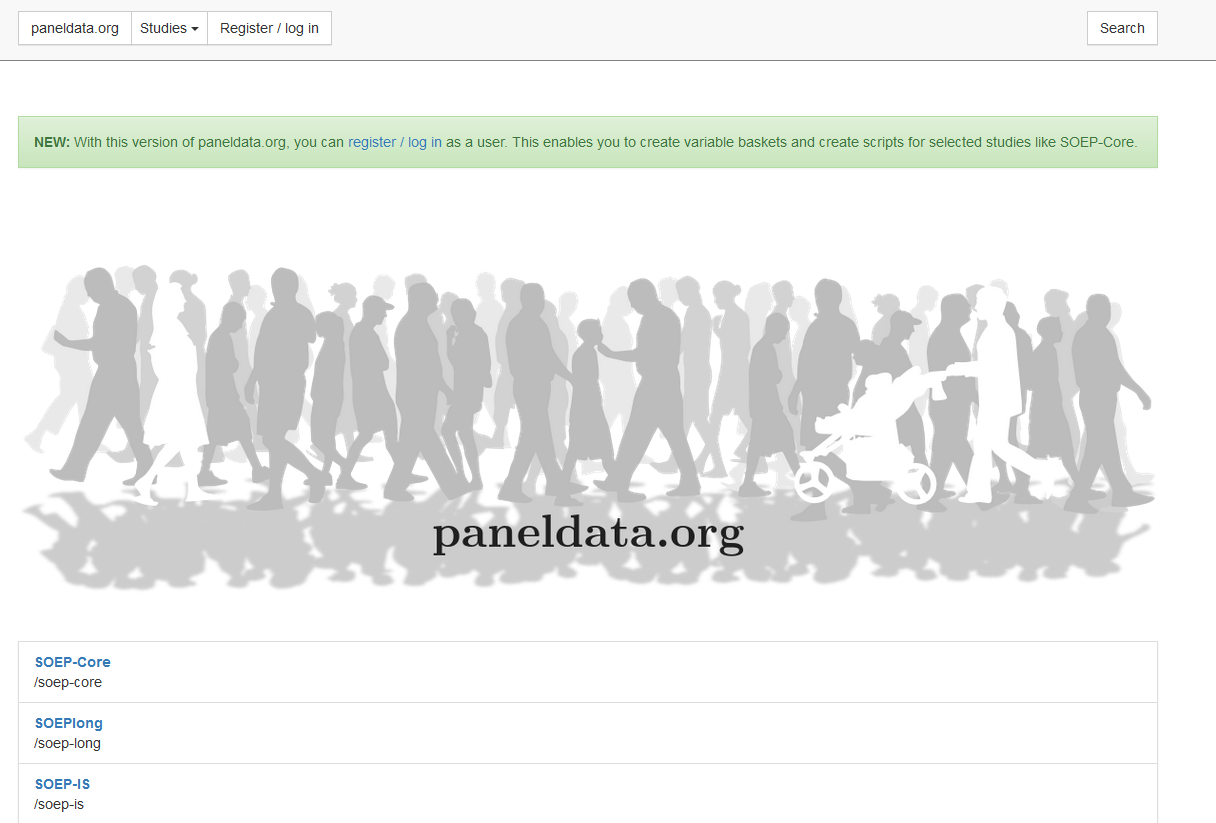
Click on the “Register/ log” to log in to paneldata.org.
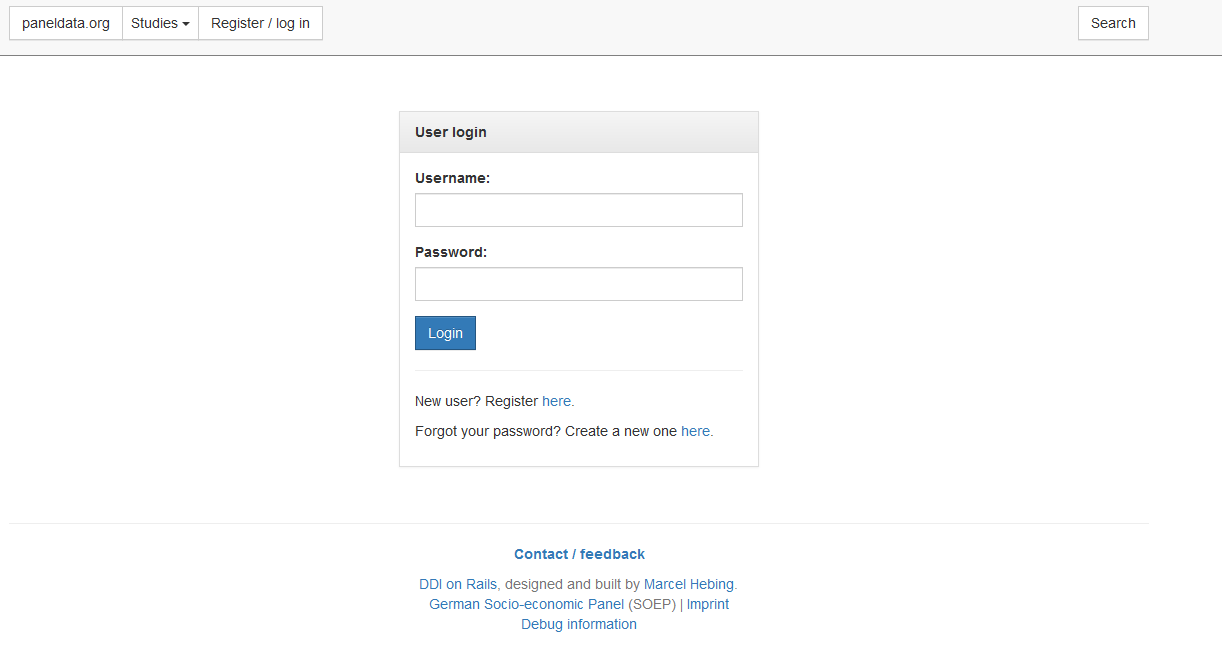
If you have already registered, you can login in the “User login” area. As a new user you can register at “Register here”. Once you have logged in successfully, you have access to the variable basket and the syntax generator.
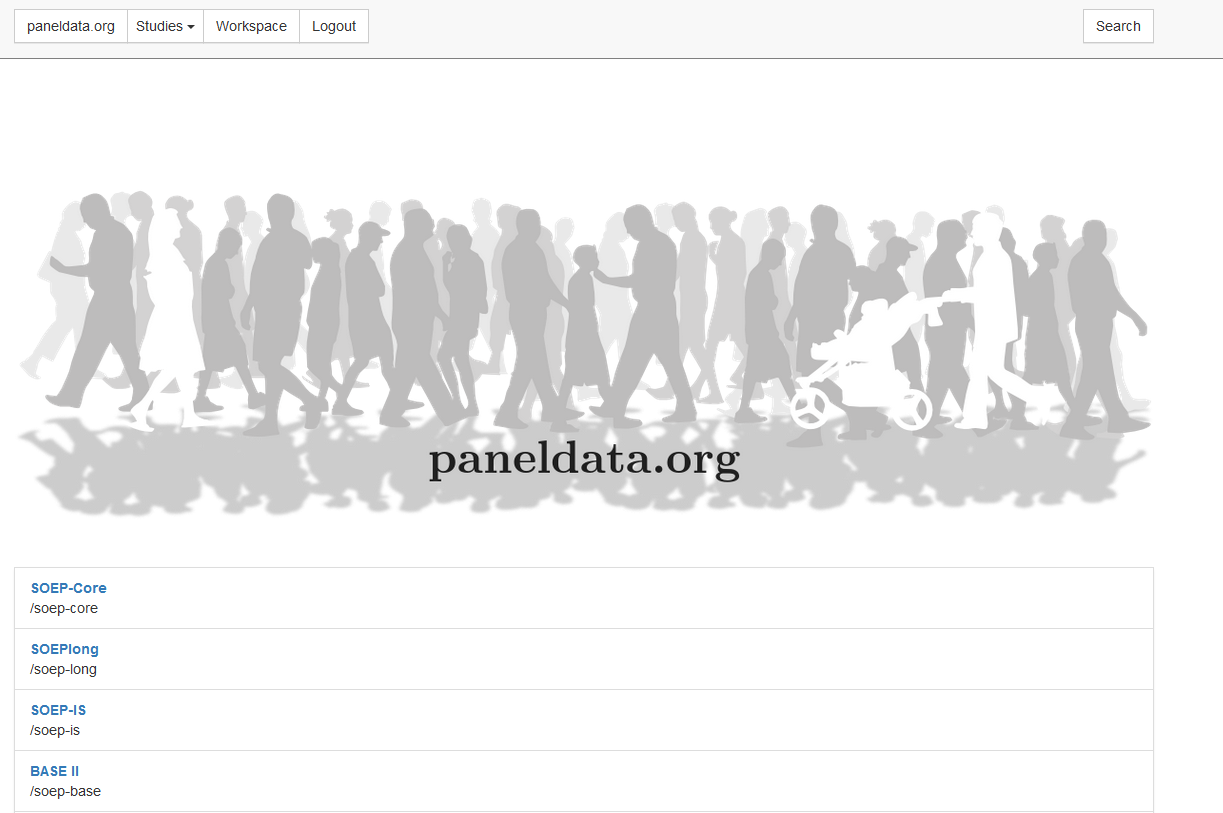
To access the activated functions, click on the navigation field “Workspace”. You will be taken to your personal workspace on paneldata.org.
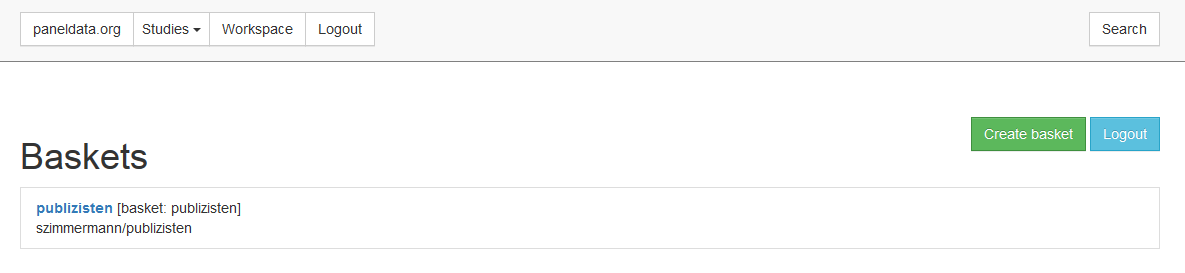
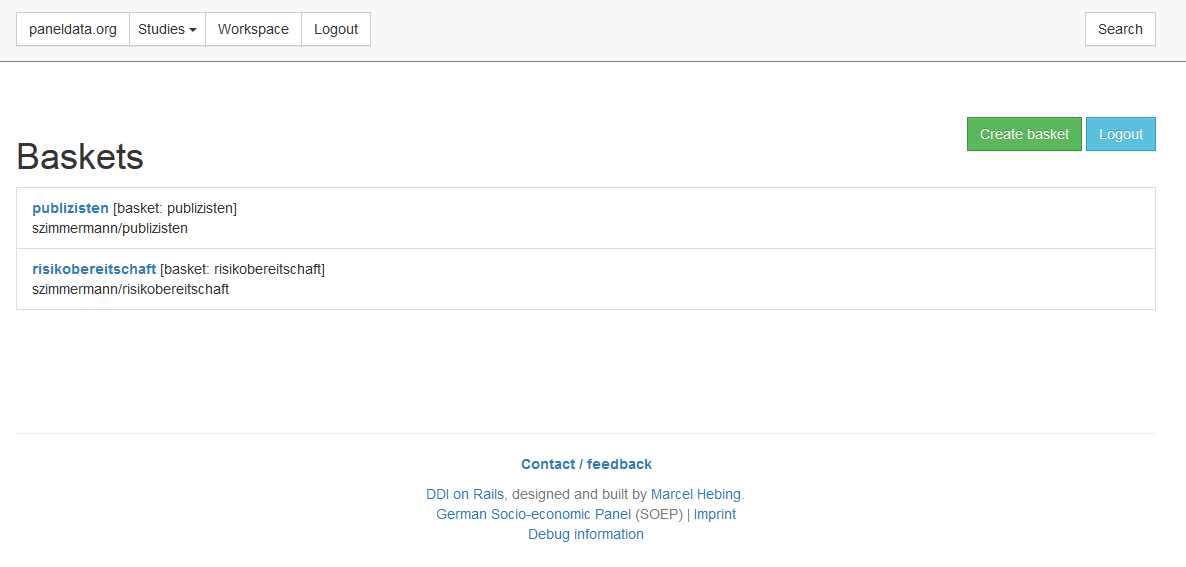
The “Workspace” displays your created variable baskets. If you click on “Create basket”, you can create a new basket.
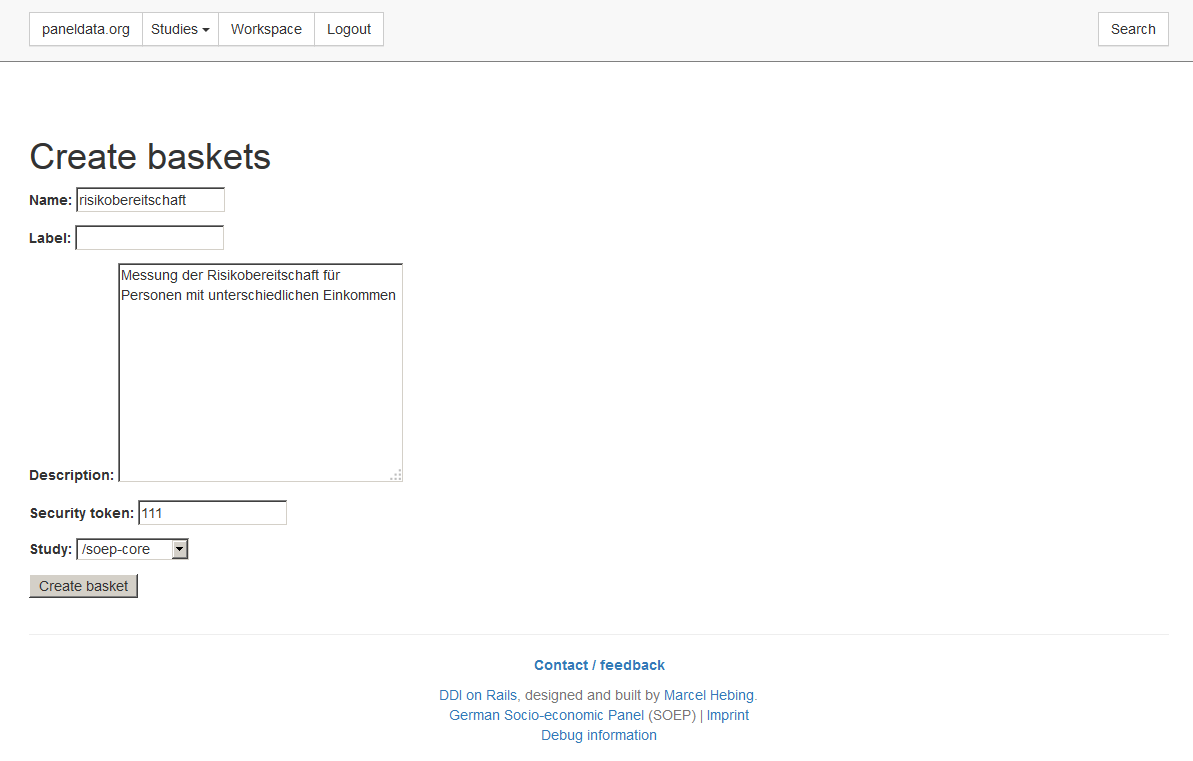
When creating the basket, first define the name of the variable basket. The name must be lower case to be accepted by Paneldata. Optionally, you can assign a label and enter a description. You can create a security key via “Security token”. Finally, you select the study that you want to use as a database for your research. Now click on “Create basket” and your newly created variable basket appears in the “Workspace” interface.
Now search for your relevant variables on paneldata.org and add them to your individual basket. For example, you are interested in the monthly net household income. If you do not know the variable name, you can find the superordinate concept using the topic search. Click on the navigation field “paneldata.org” to get to the main page. Select the study SOEP-Core and click on the navigation field “Topics”.
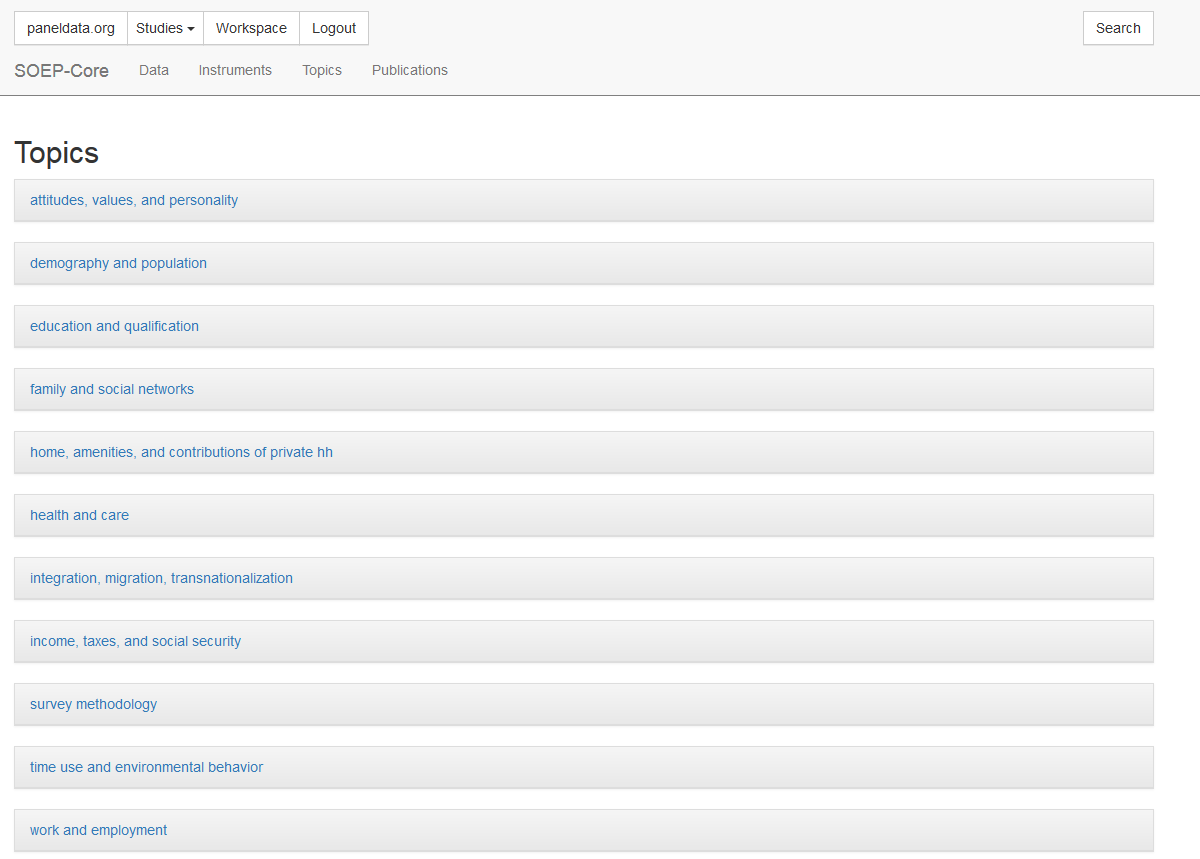
Check the different topics for income-relevant concepts and select “income, taxes, and social security”.
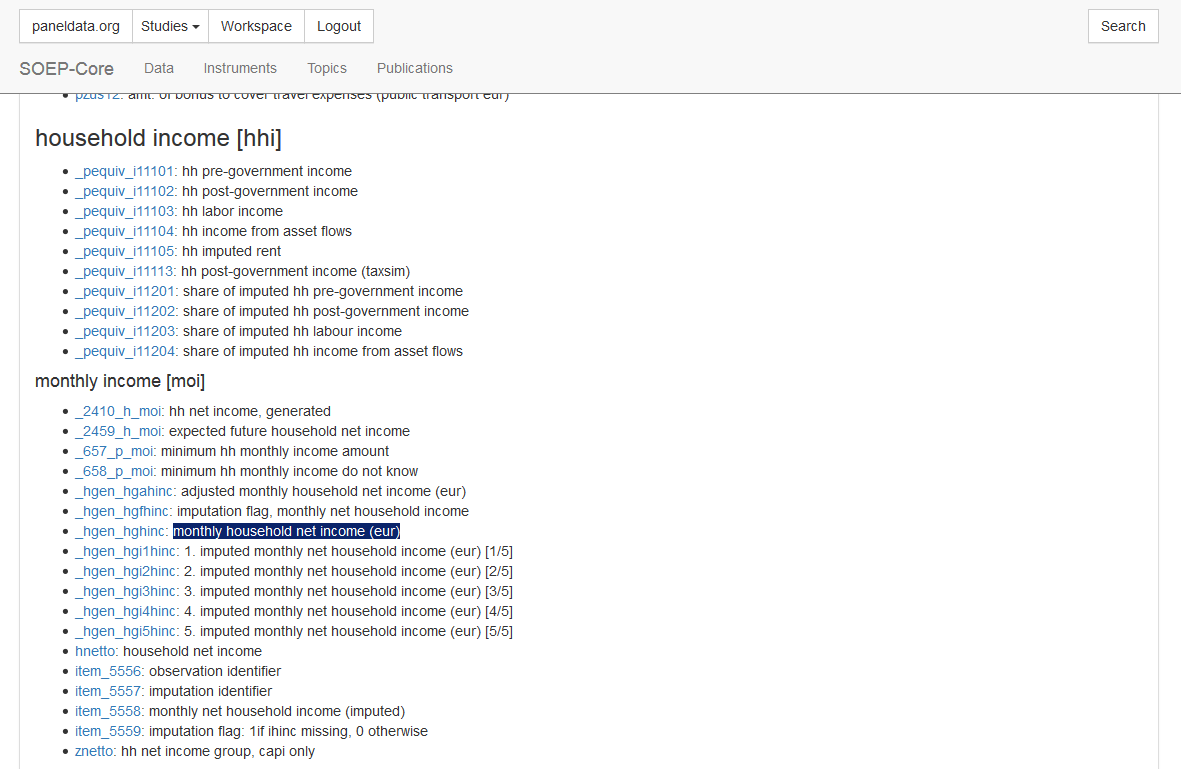
Browse the topic list and you will reach the sub-topic “household income hhi”. There you will find the concept you are looking for under “monthly income moi”. Click on the concept and you will see the history of variables, possible links to other studies and perhaps the question in metadata-based form.

Select the variable of your desired study SOEP-Core and you will reach the variable overview with important information about the variable. In the variable overview, you should make sure that the variable also meets your requirements.

When logged in, the Basket area appears in the overview of variables. Your baskets are listed there. If you want to add the variable to a basket, click on “Add to basket”. If the variable is already in the basket and you want to remove it, select “Remove from basket”. If you want to create a new basket within the overview of variables, click on “Create a new basket” to go to basket creation and its variable is automatically placed in the new basket. You can access the basket overview by clicking on the name of your basket in the “Basket” section. Alternatively, you can click on the navigation field “Workspace” and you will also return to the basket overview.
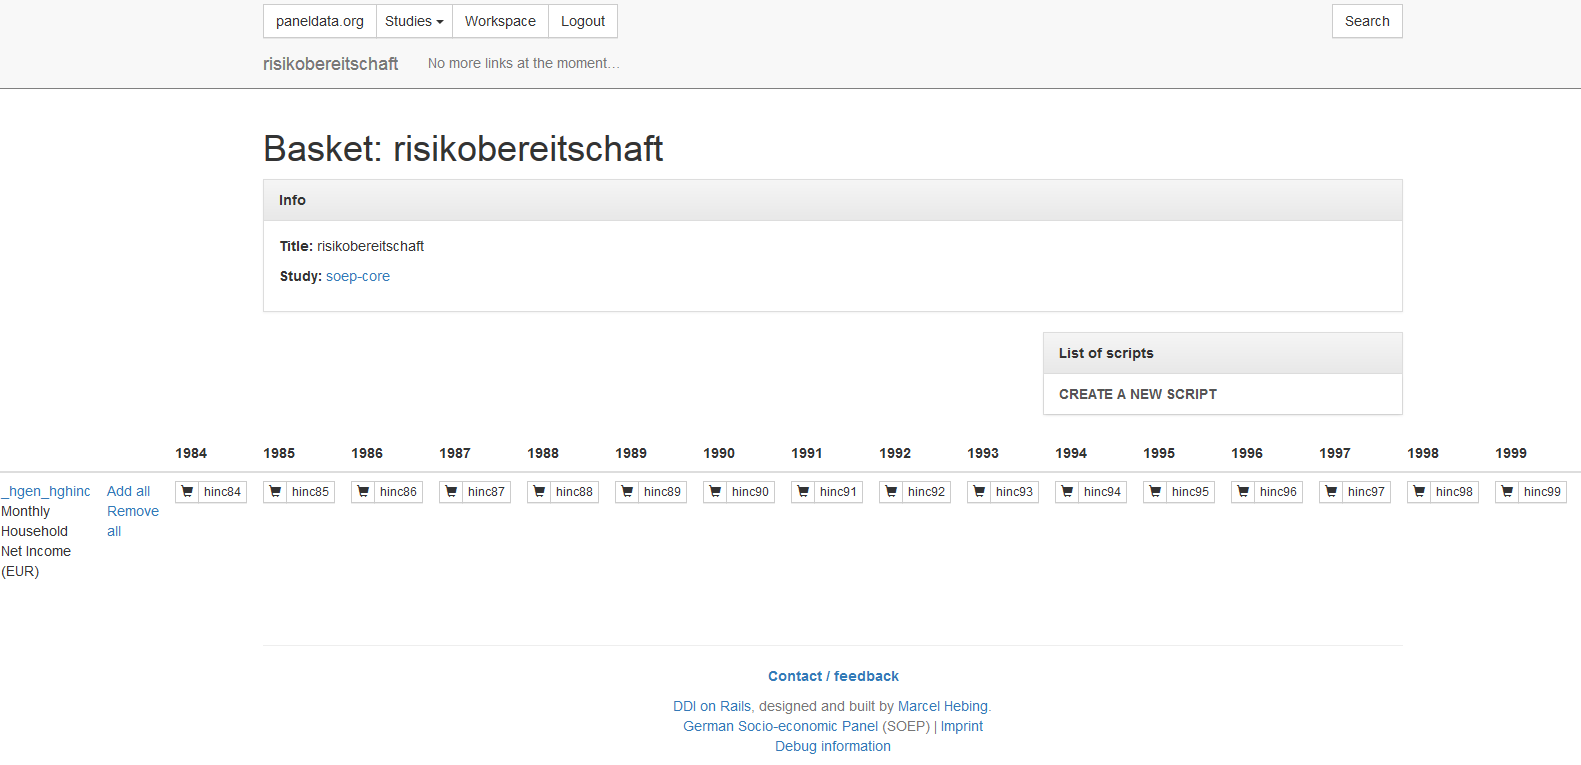
Click on the basket with your added variable and you will get an overview of all variables in your basket. With “Add all” you add the variables of all survey waves and the shopping cart is highlighted in green. If you are interested in a specific survey period, you can select the wave-specific variables by clicking on the shopping cart. Click on “Remove all” to remove the variable from your basket.
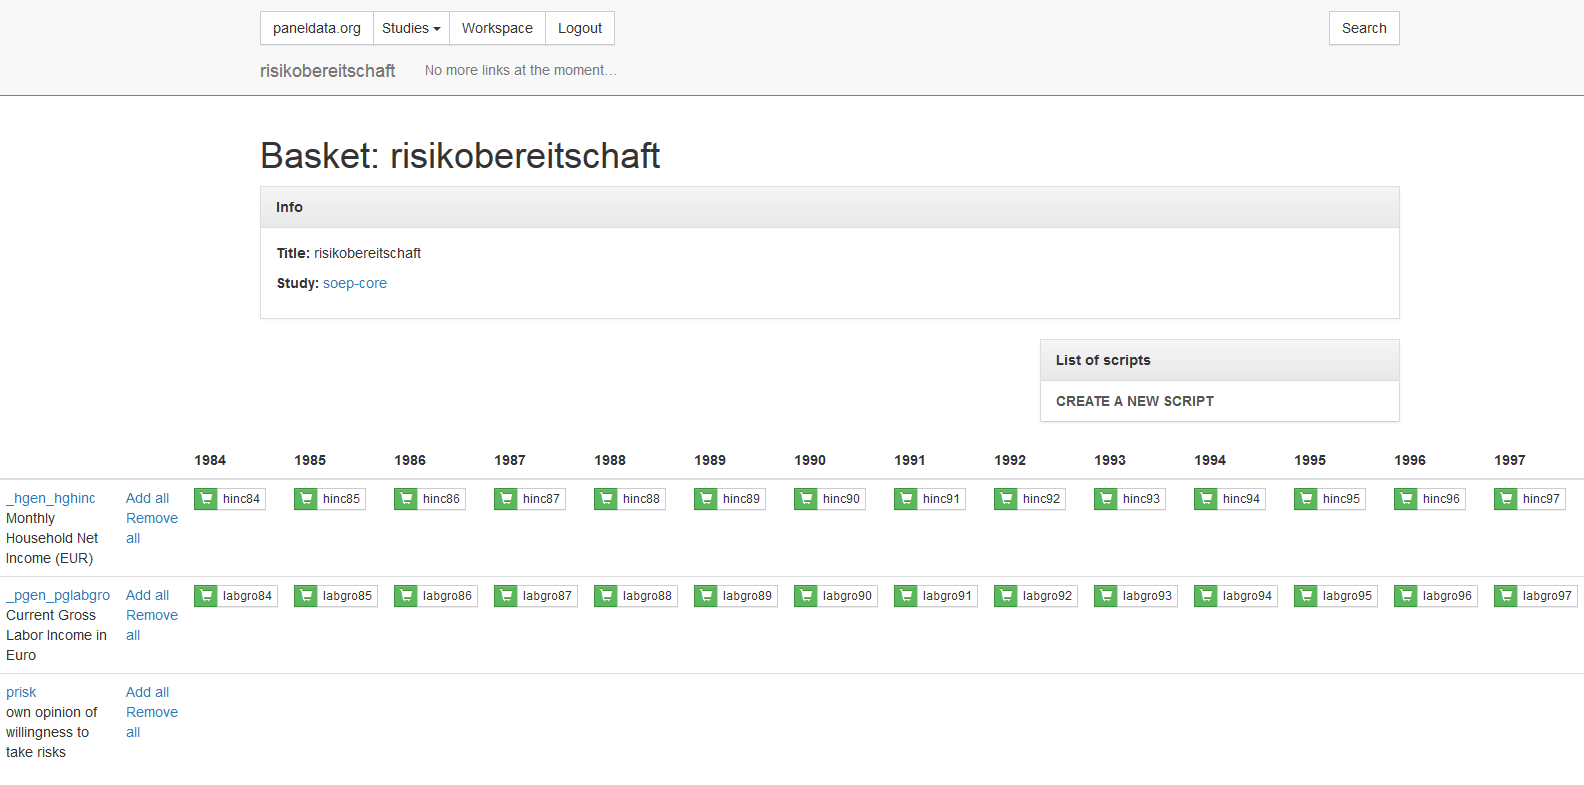
Once you have filled your basket and selected the desired survey waves, you can merge all variables into one data set. To do this, click on “CREATE A NEW SCRIPT” in the “List of scripts” area.
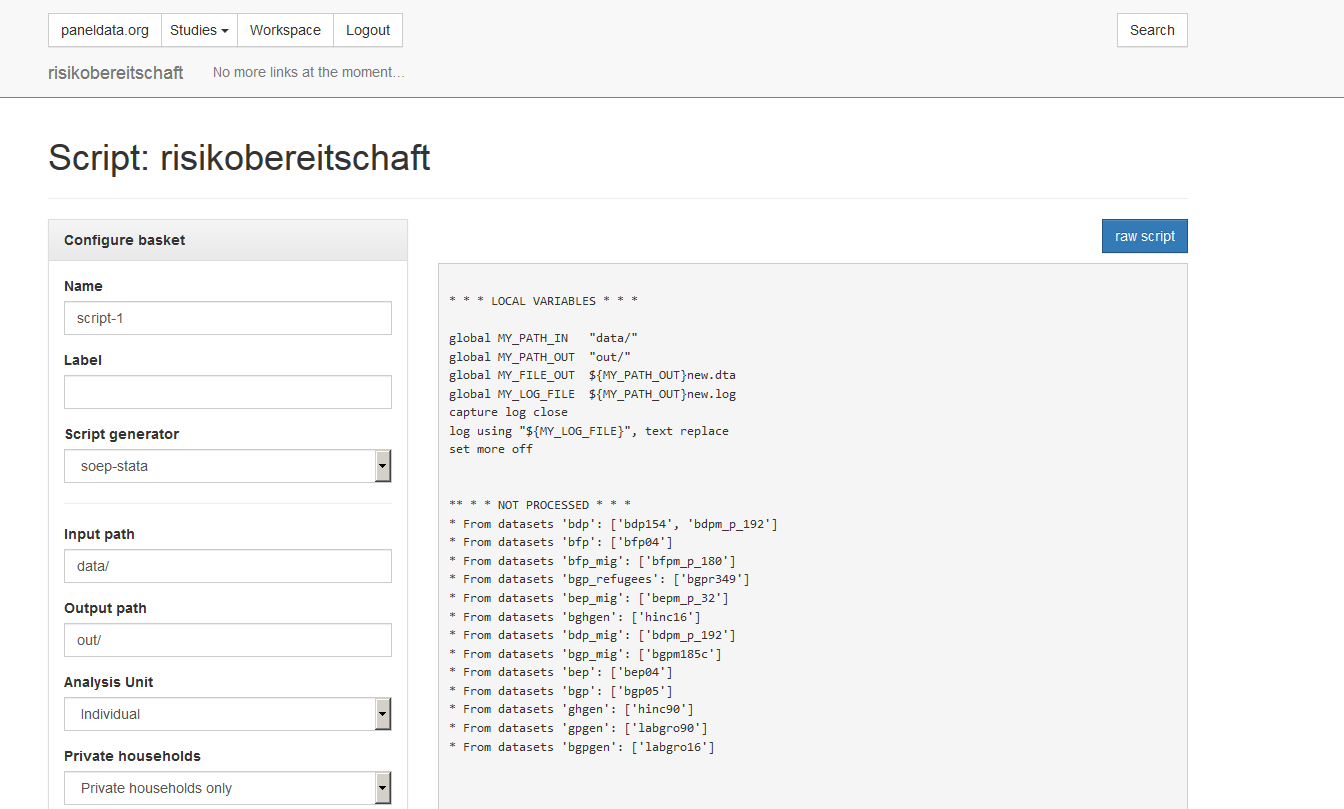
In the script generator you can create a script that matches your preferred variables. Specify the name of your script. Select the statistics program you are using. Then enter the path where you have stored your data records in the “Input path”. In the “Output path” you write your desired output path for the created data set.
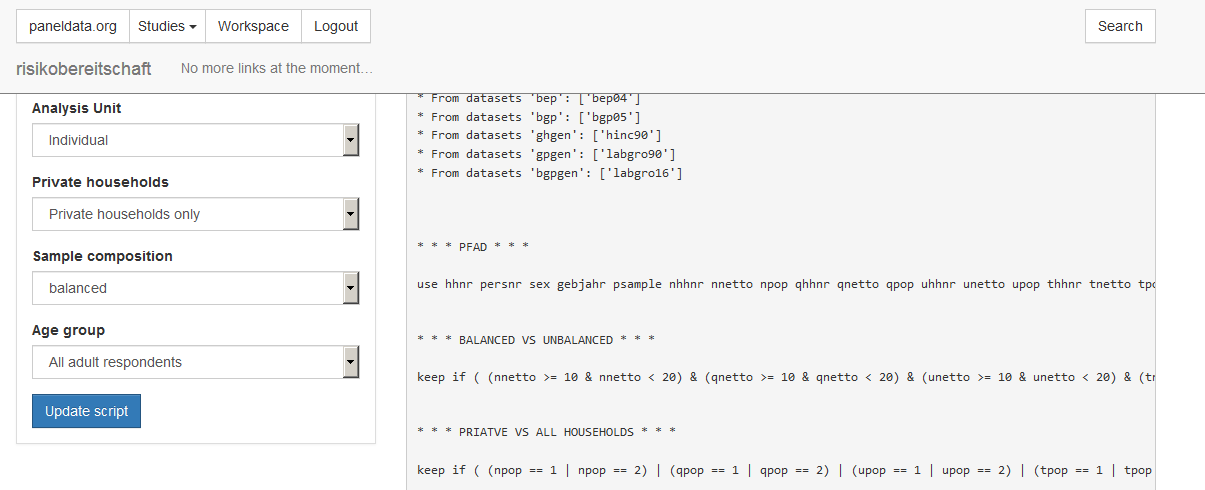
In the “Analysis Unit” section, you decide whether all persons are considered individually within the household (“Individual”) or whether you are only interested in the household as a whole (“Household”). With “Sample composition” you can choose between “balanced” and “unbalanced”. If you select “balanced”, you will receive a data set without missing codes. The respondents provided information on all variables. For more information about balanced and unbalanced datasets visit the chapter Panel Data Analysis. Under “Age group” you can limit the respondents. When you are satisfied with your settings, click on “Update Script” and your script will be created.
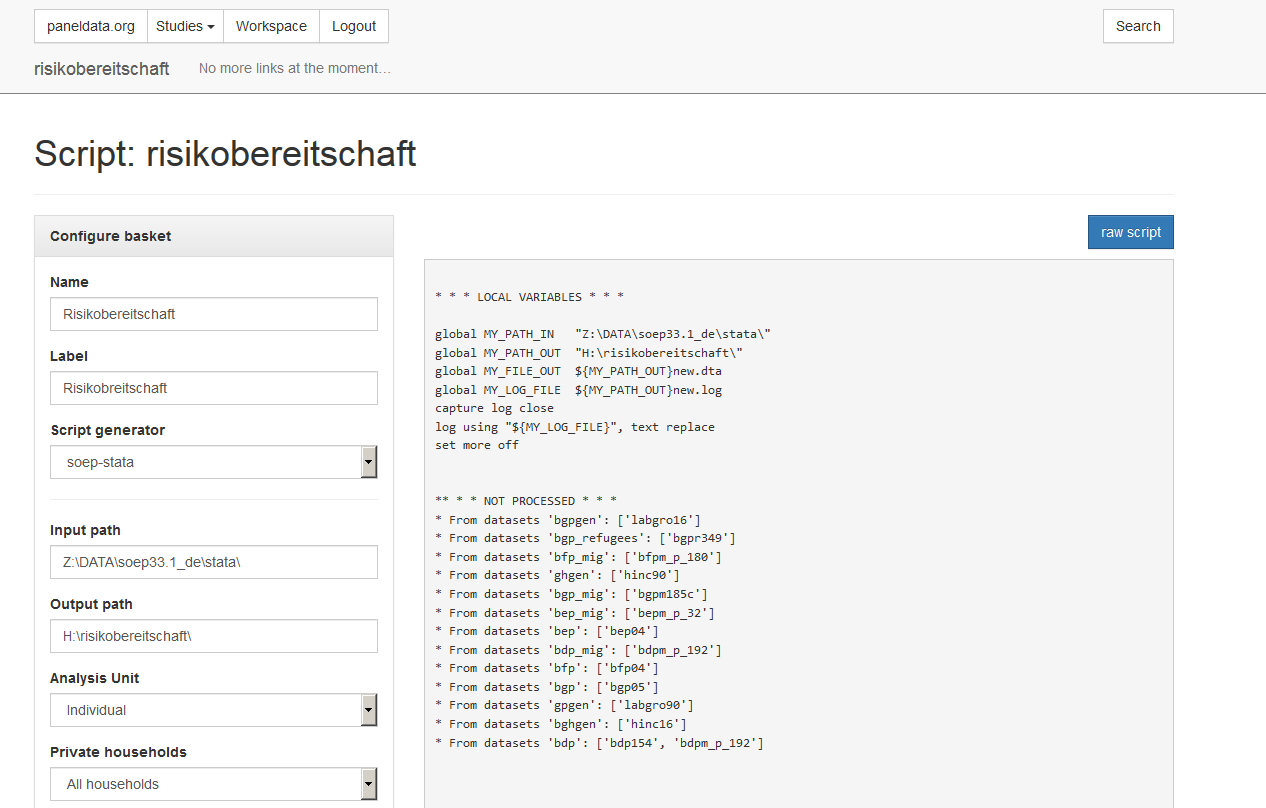
If you click on the “raw script” button, the script is displayed in text form. Copy it to your statistics software. To name the data set correctly, you should change the name of the data set in the script. Execute the script with your statistics software and you will receive your data set with all your choosen variables.